Since React is the most widely used JavaScript framework for building component-based apps, it gives access to a number of tools, resources and best practices that can help troubleshoot software when things go wrong.
To create a top-notch React application, you can't ignore the debugging phase of your software development lifecycle. This includes handling error messages during development and monitoring real-time errors in production.
In this article, we'll go into the details of React debugging, examine the most common bugs and learn the most effective techniques.
Since React is a JavaScript library, React debugging falls under the category of JavaScript debugging. The good news is that you can use many of the same techniques and tools that are used for fixing regular JavaScript code.
Apart from the core React framework, there are several client-side libraries based on React that may require debugging. For example, React Bootstrap and Fluent UI are used for web-based user interfaces, while Gatsby and Docusaurus are employed for static site generation (SSG) and React Native is used for native app development. When it comes to debugging apps built with these libraries, you can treat them like typical client-side React applications and apply the same tools and techniques.
However, not all React apps are rendered in the browser. Server-side rendering (SSR) is a popular web performance optimization technique used by many applications. In such cases, you can treat these SSR React apps as NodeJS apps and leverage NodeJS debugging tools and best practices to resolve issues that arise. Also, you can use some React debugging tools, such as Visual Studio Code and Raygun, to debug React applications that are rendered on the server side.
Statistics show that the framework is used by almost 83% of developers and a significant number of React-based client-side libraries are employed in various applications. This highlights the importance of mastering React debugging techniques to ensure the smooth running of your React projects.
During React development, engineers may encounter several types of errors that can occur during the process. Familiarizing yourself with them can help developers quickly identify and fix problems. Here are some of the most common types of errors in React.
React applications are built with reusable components, which means that the user interface doesn't always look as expected. While debugging ReactJS apps, UI bugs are usually easy to spot, as you can visually notice when something doesn't appear quite right on the screen. Examples include elements such as buttons or the overall layout.
These bugs are tied to the logic and behavior of the React application and can lead to inaccurate calculations, unexpected behavior or improper handling of data. Logic errors can result from incorrect conditional statements and erroneous data manipulation.
These bugs occur when a network request fails, resulting in an incomplete or delayed downloading of one or more resources. This can happen when you make requests to your own server or when you retrieve third-party assets such as embedded content or static files stored in a content delivery network (CDN).
Network bugs can also result from the unpredictable behavior of third-party services on which your React application depends. In such cases, you may need to work with the service provider to fix the problem or find an alternative service.
Regression errors are functions that performed correctly in the past but now no longer work, often after a new code release. React applications experiencing rapid growth are particularly prone to these types of bugs. However, through thorough testing, including regression testing and continuous monitoring, you can prevent causing regressions in already working features.
ReactJS is popular among developers because it effortlessly creates large-scale web applications. However, despite its popularity, engineers may face challenges when troubleshooting issues. Now, we'll delve into valuable techniques that you can use to increase your efficiency when debugging ReactJS apps.
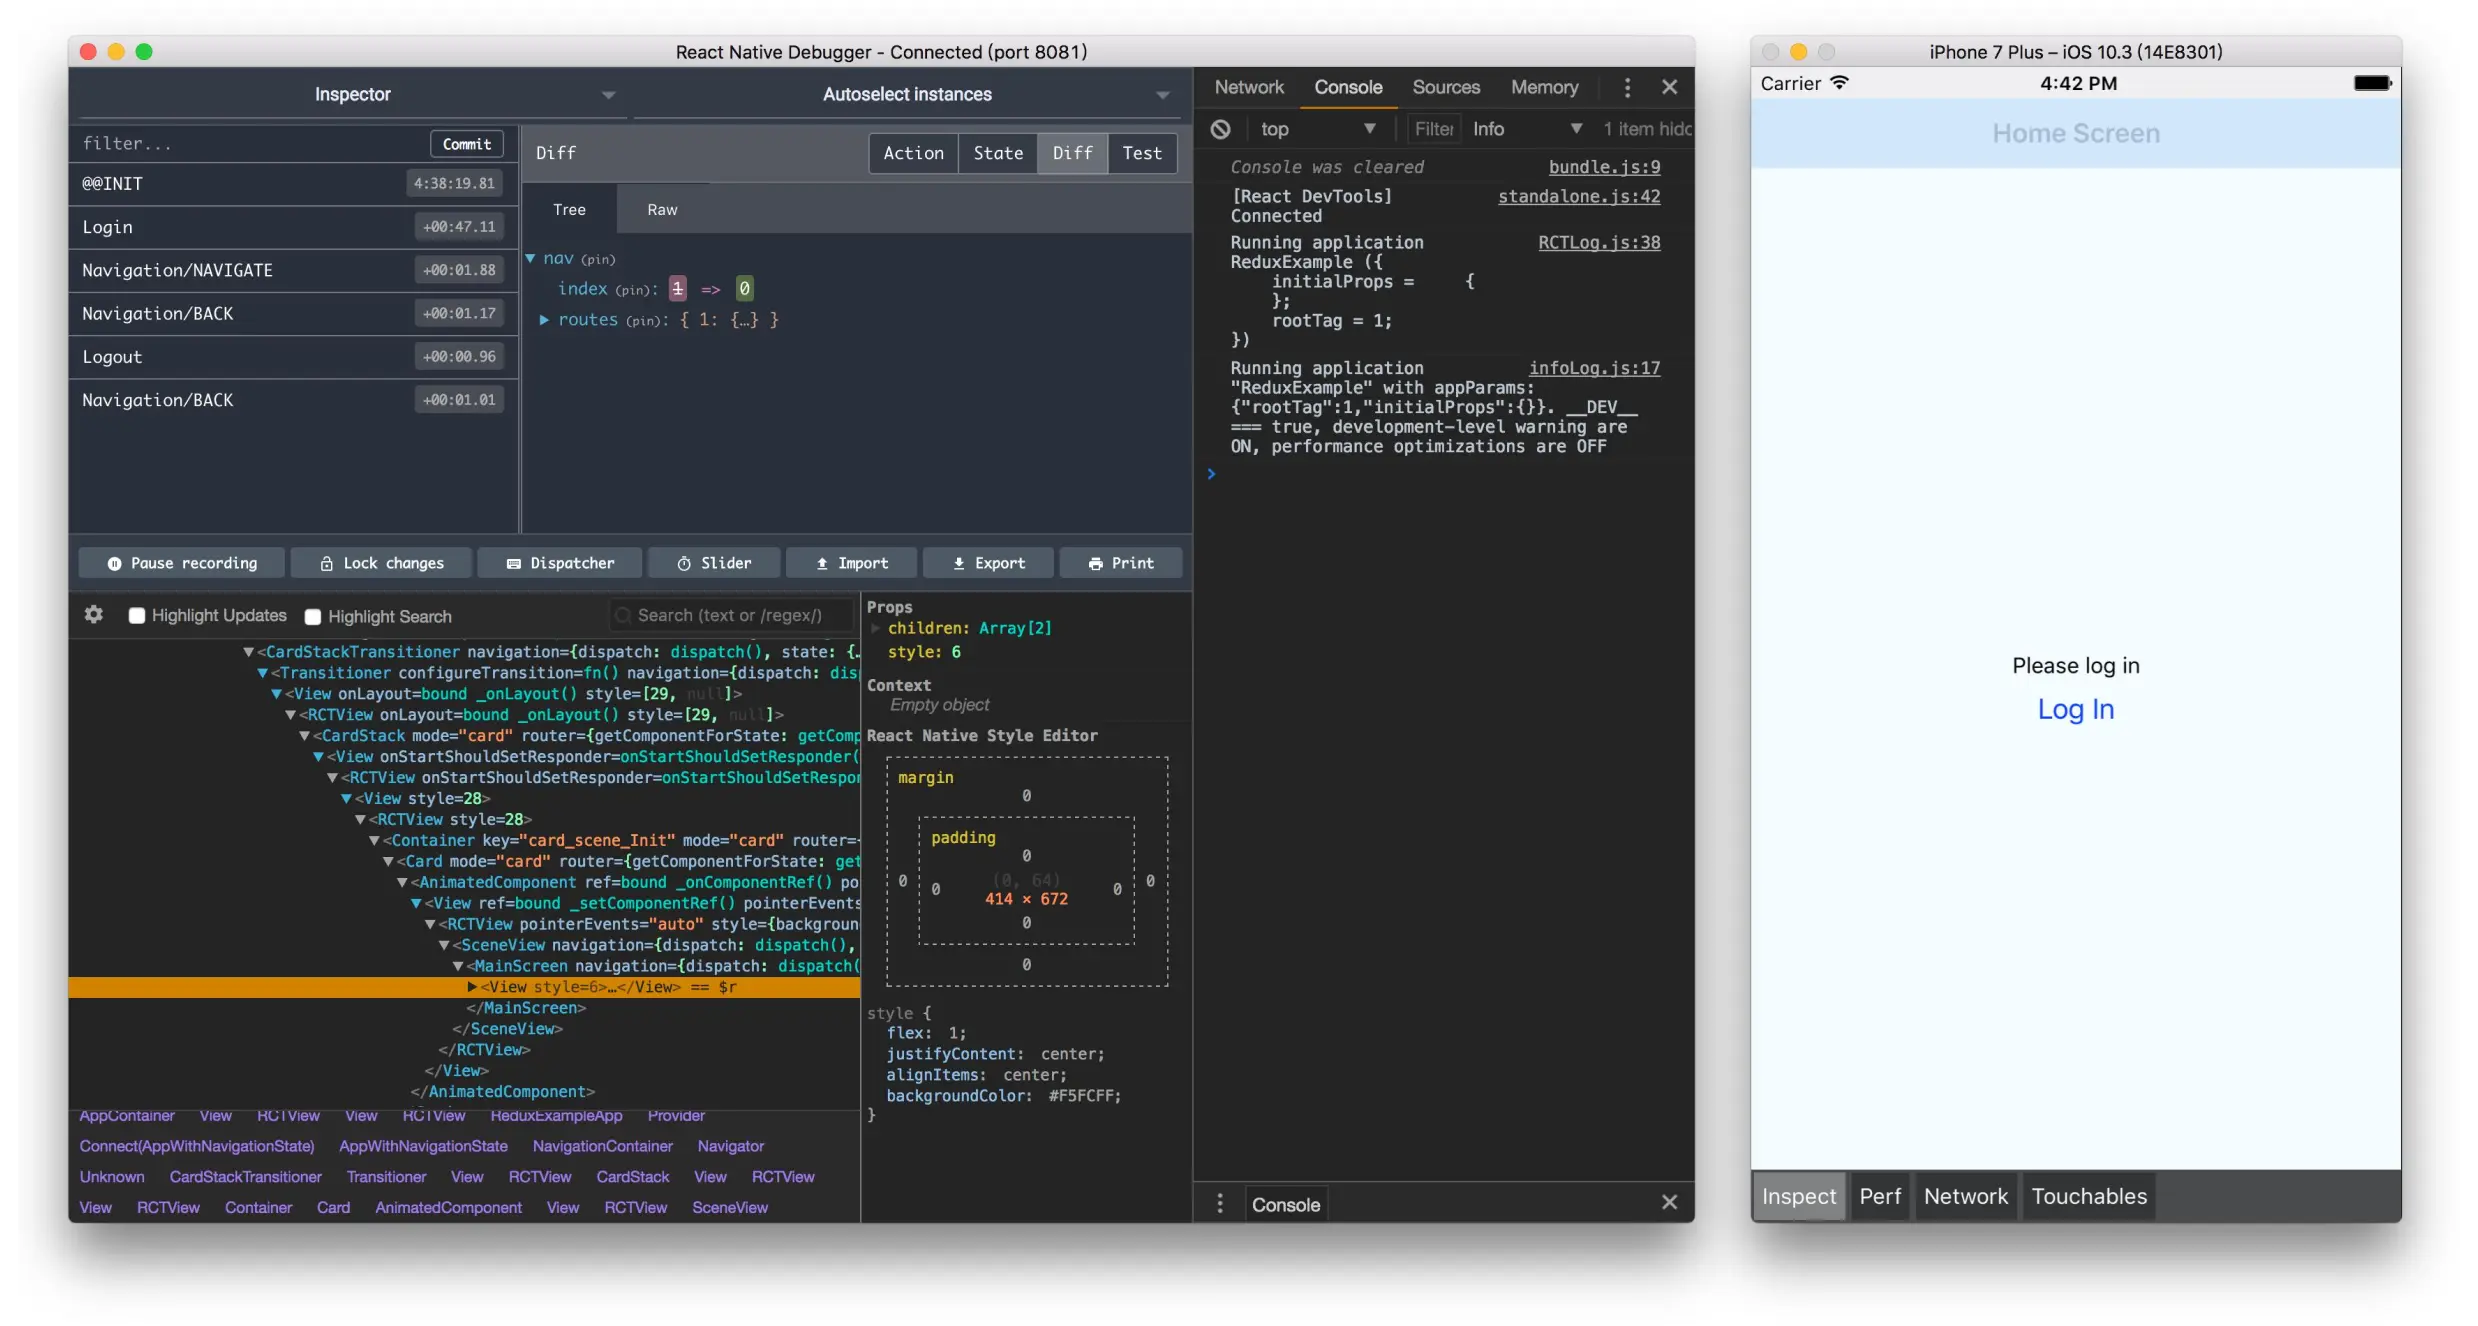
React Developer Tools is a browser extension that allows engineers to explore the React component hierarchy and monitor the props and health of each component. This tool can be easily downloaded and installed as an extension for both Chrome and Firefox.
Once installed, developers can access the React tab in their browser's development tools to examine the component hierarchy, state and props.
With this React debugging extension, it is easier to pinpoint issues in the component hierarchy and identify incorrect or missing props. Also, this tool tracks down unnecessary re-renders in the application, which helps improve performance optimization.
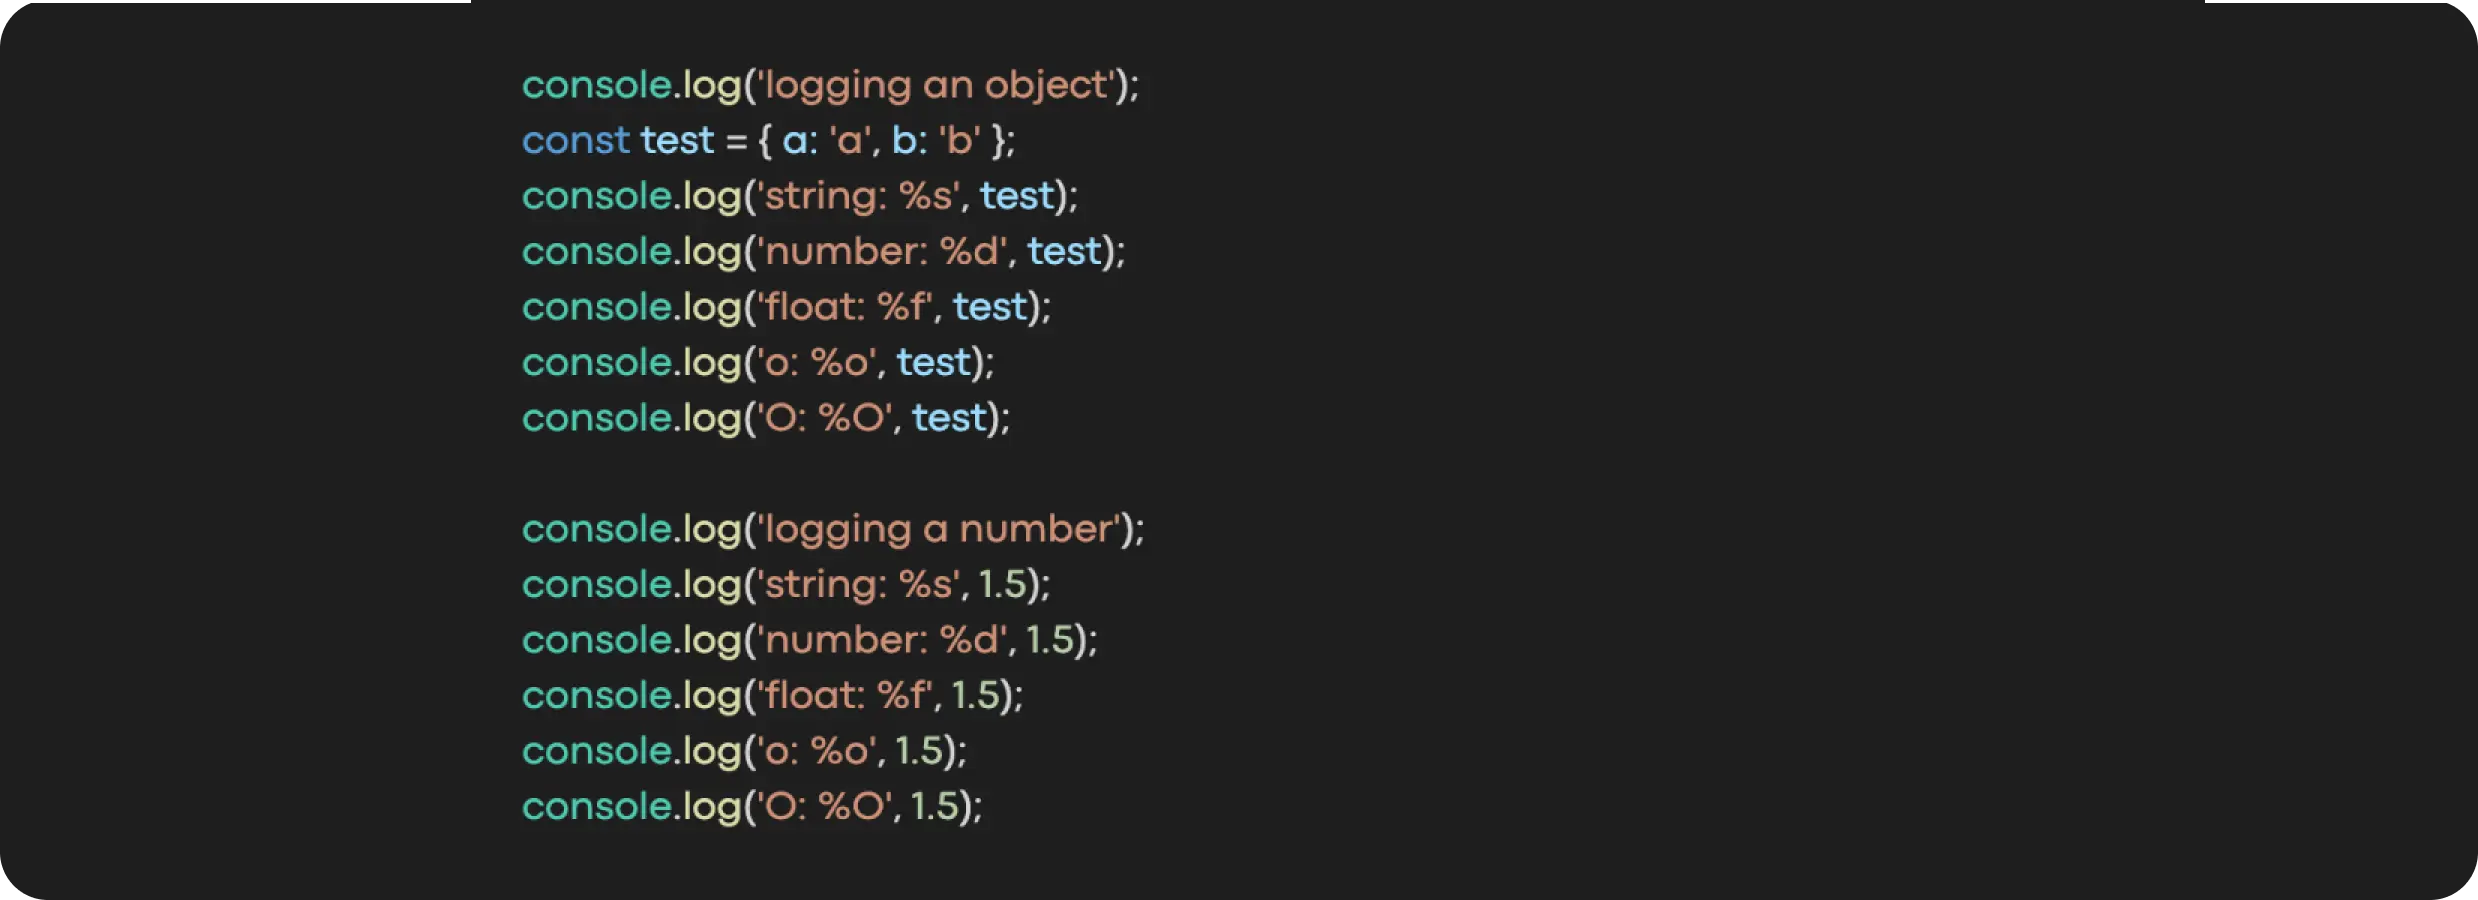
Console logging is a basic technique used by developers to debug their applications. When working with React.js applications, console logging proves useful for detecting issues related to the component's state or props.
If a component fails to render as intended, the developer can insert a console.log() statement in the component and examine it for potential errors. This allows problems related to the component's state or props to be identified, which facilitates effective React debugging.
Breakpoints are a valuable tool for debugging ReactJS apps. They can be set in the code using the debugger statement, which pauses the code execution at that particular point. Once code execution is halted, developers can examine the state, props and other relevant information in the browser's developer tools.
By targeting breakpoints in the code, developers can effectively identify issues related to component states or props. This allows them to walk through the code step-by-step, making it easier to identify logic-related problems.
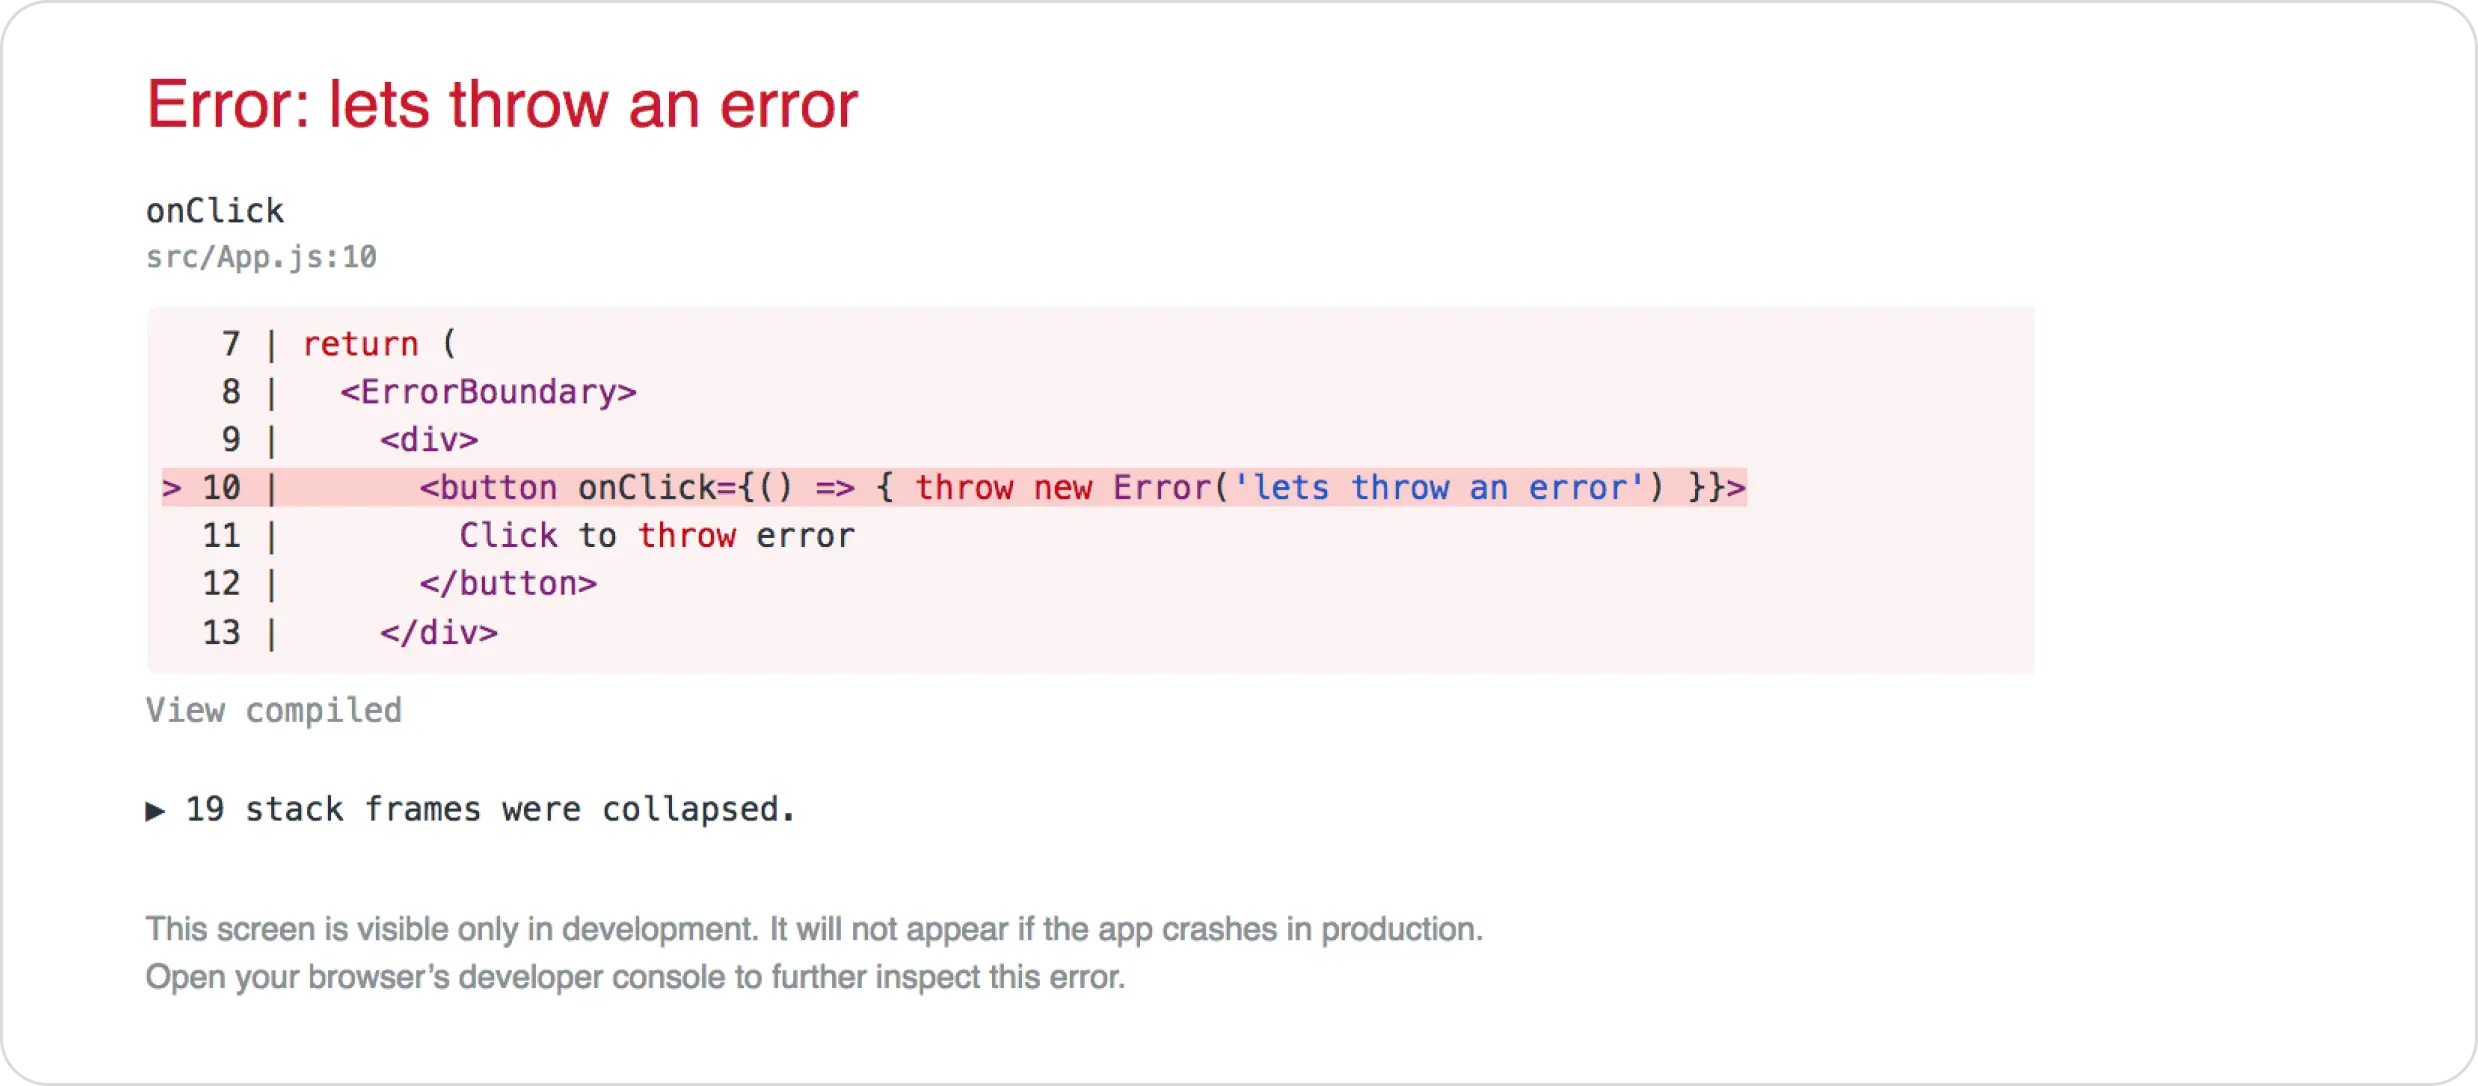
Error boundaries, introduced in ReactJS version 16, are a valuable feature for handling bugs during rendering. These special components catch errors and prevent them from causing a complete crash of an application.
To implement a bug boundary, developers can create a new component that wraps around the fault-prone components. When a mistake occurs, the error boundary component catches the error and displays a fallback UI instead of causing a crash.
This React debugging technique allows developers to isolate and fix problems in individual components, ensuring that a single error in one component doesn't bring down the entire application.
When developing ReactJS applications, certain issues often arise, such as incorrect prop types, undefined variables and improper state updates. To effectively resolve them, developers can employ the following techniques:
By proactively looking for these common issues, developers can preemptively resolve potential problems and improve the overall software quality while debugging the ReactJS app.
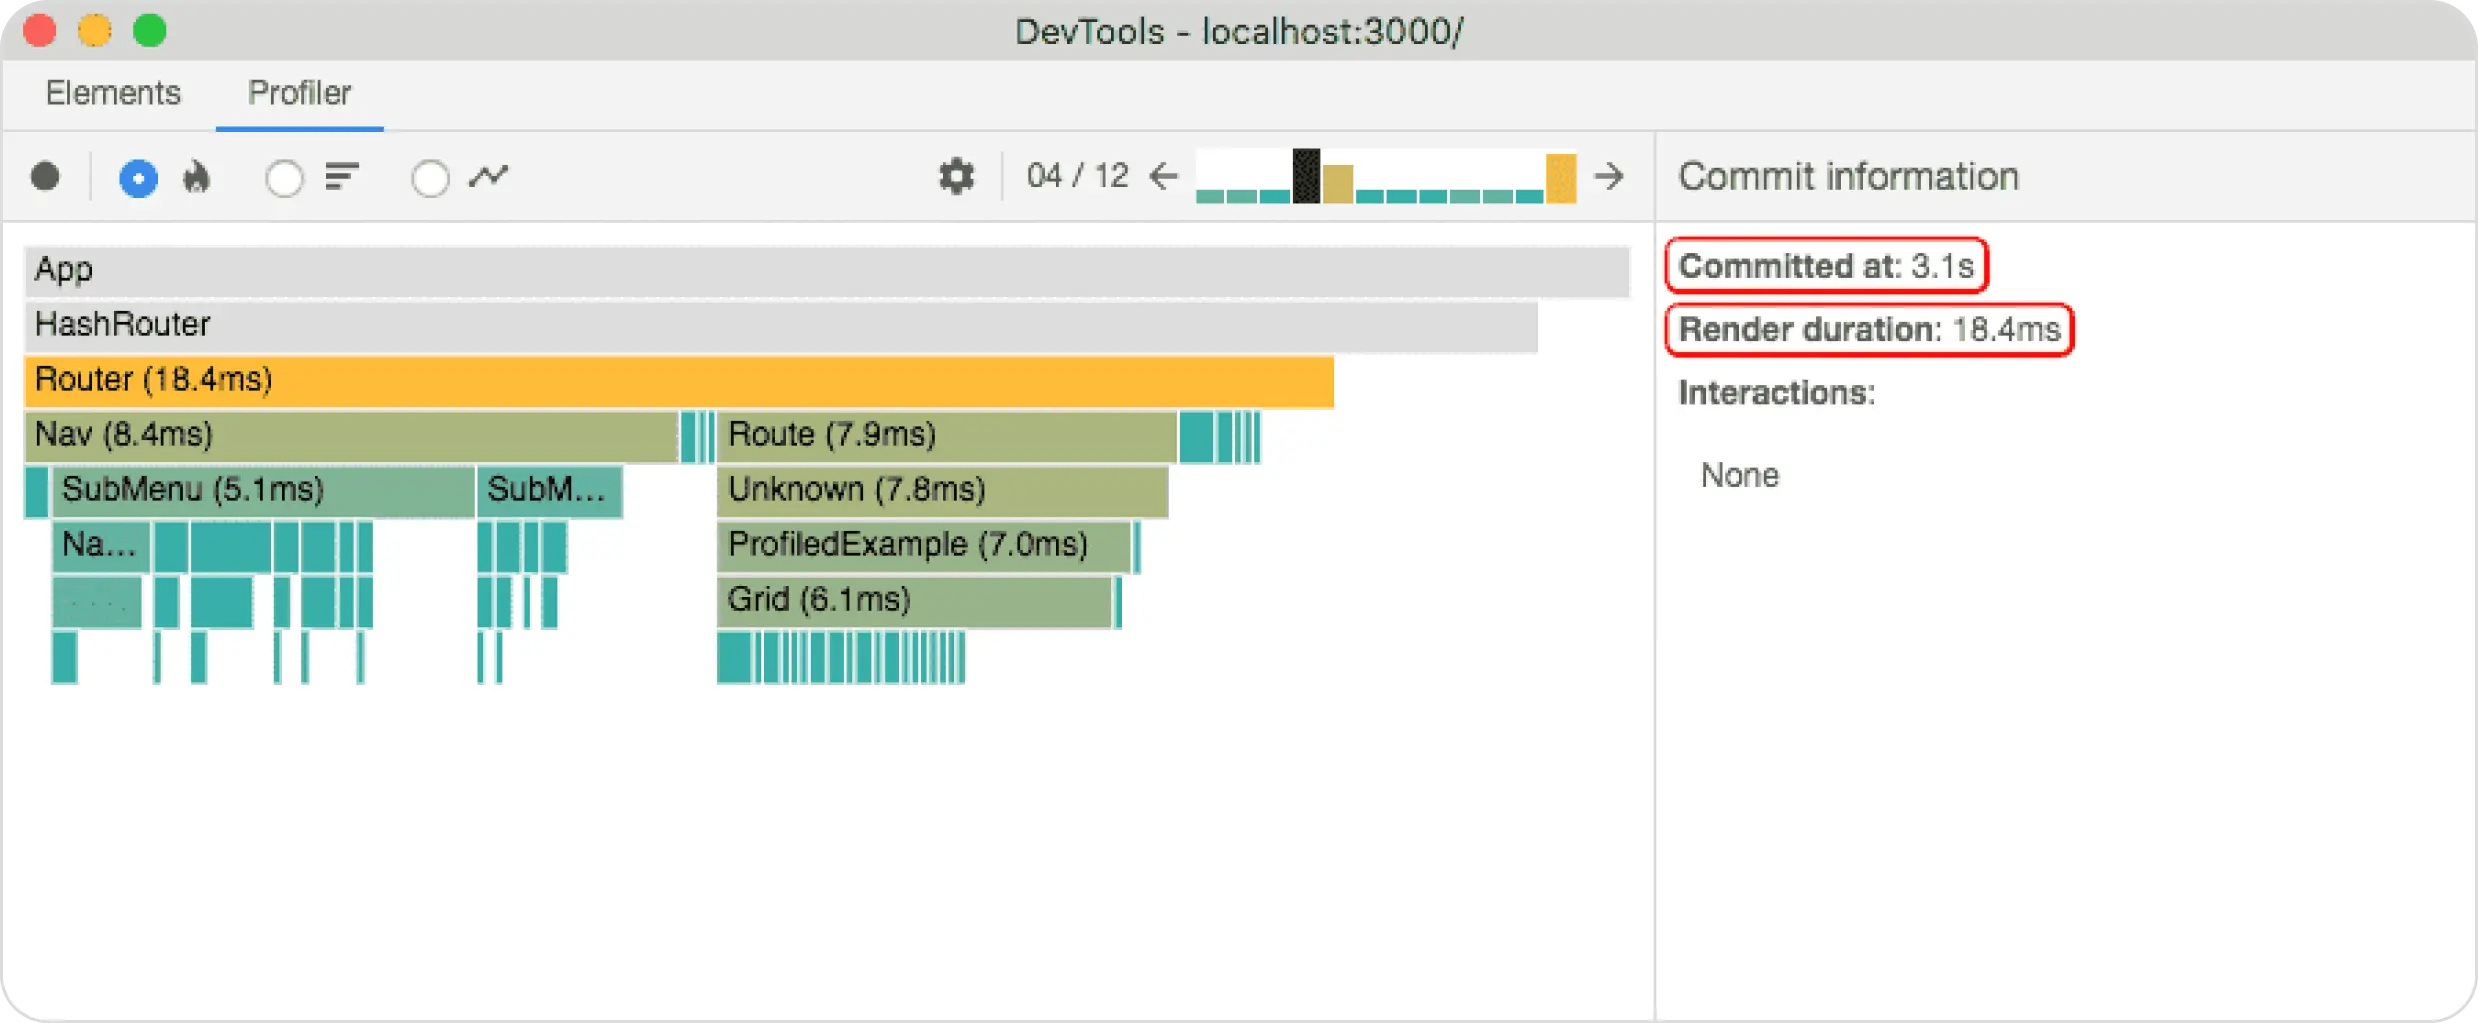
The React Profiler is a powerful tool introduced in ReactJS version 16.5 to detect performance issues within an application. It analyzes the rendering time of components and allows developers to pinpoint performance bottlenecks.
With React Profiler, developers can efficiently identify components that negatively impact functionality and take targeted optimization measures to improve the overall work of the application.
React Strict Mode is invaluable in identifying and highlighting potential issues within the application during the development phase. To use this tool, you simply wrap the root component of the app with a StrictMode component.
Thus, software engineers unlock additional checks and warnings in the console during the development process. These checks and warnings play a critical role in identifying potential code issues, such as the use of deprecated lifecycle methods or unsafe component practices.
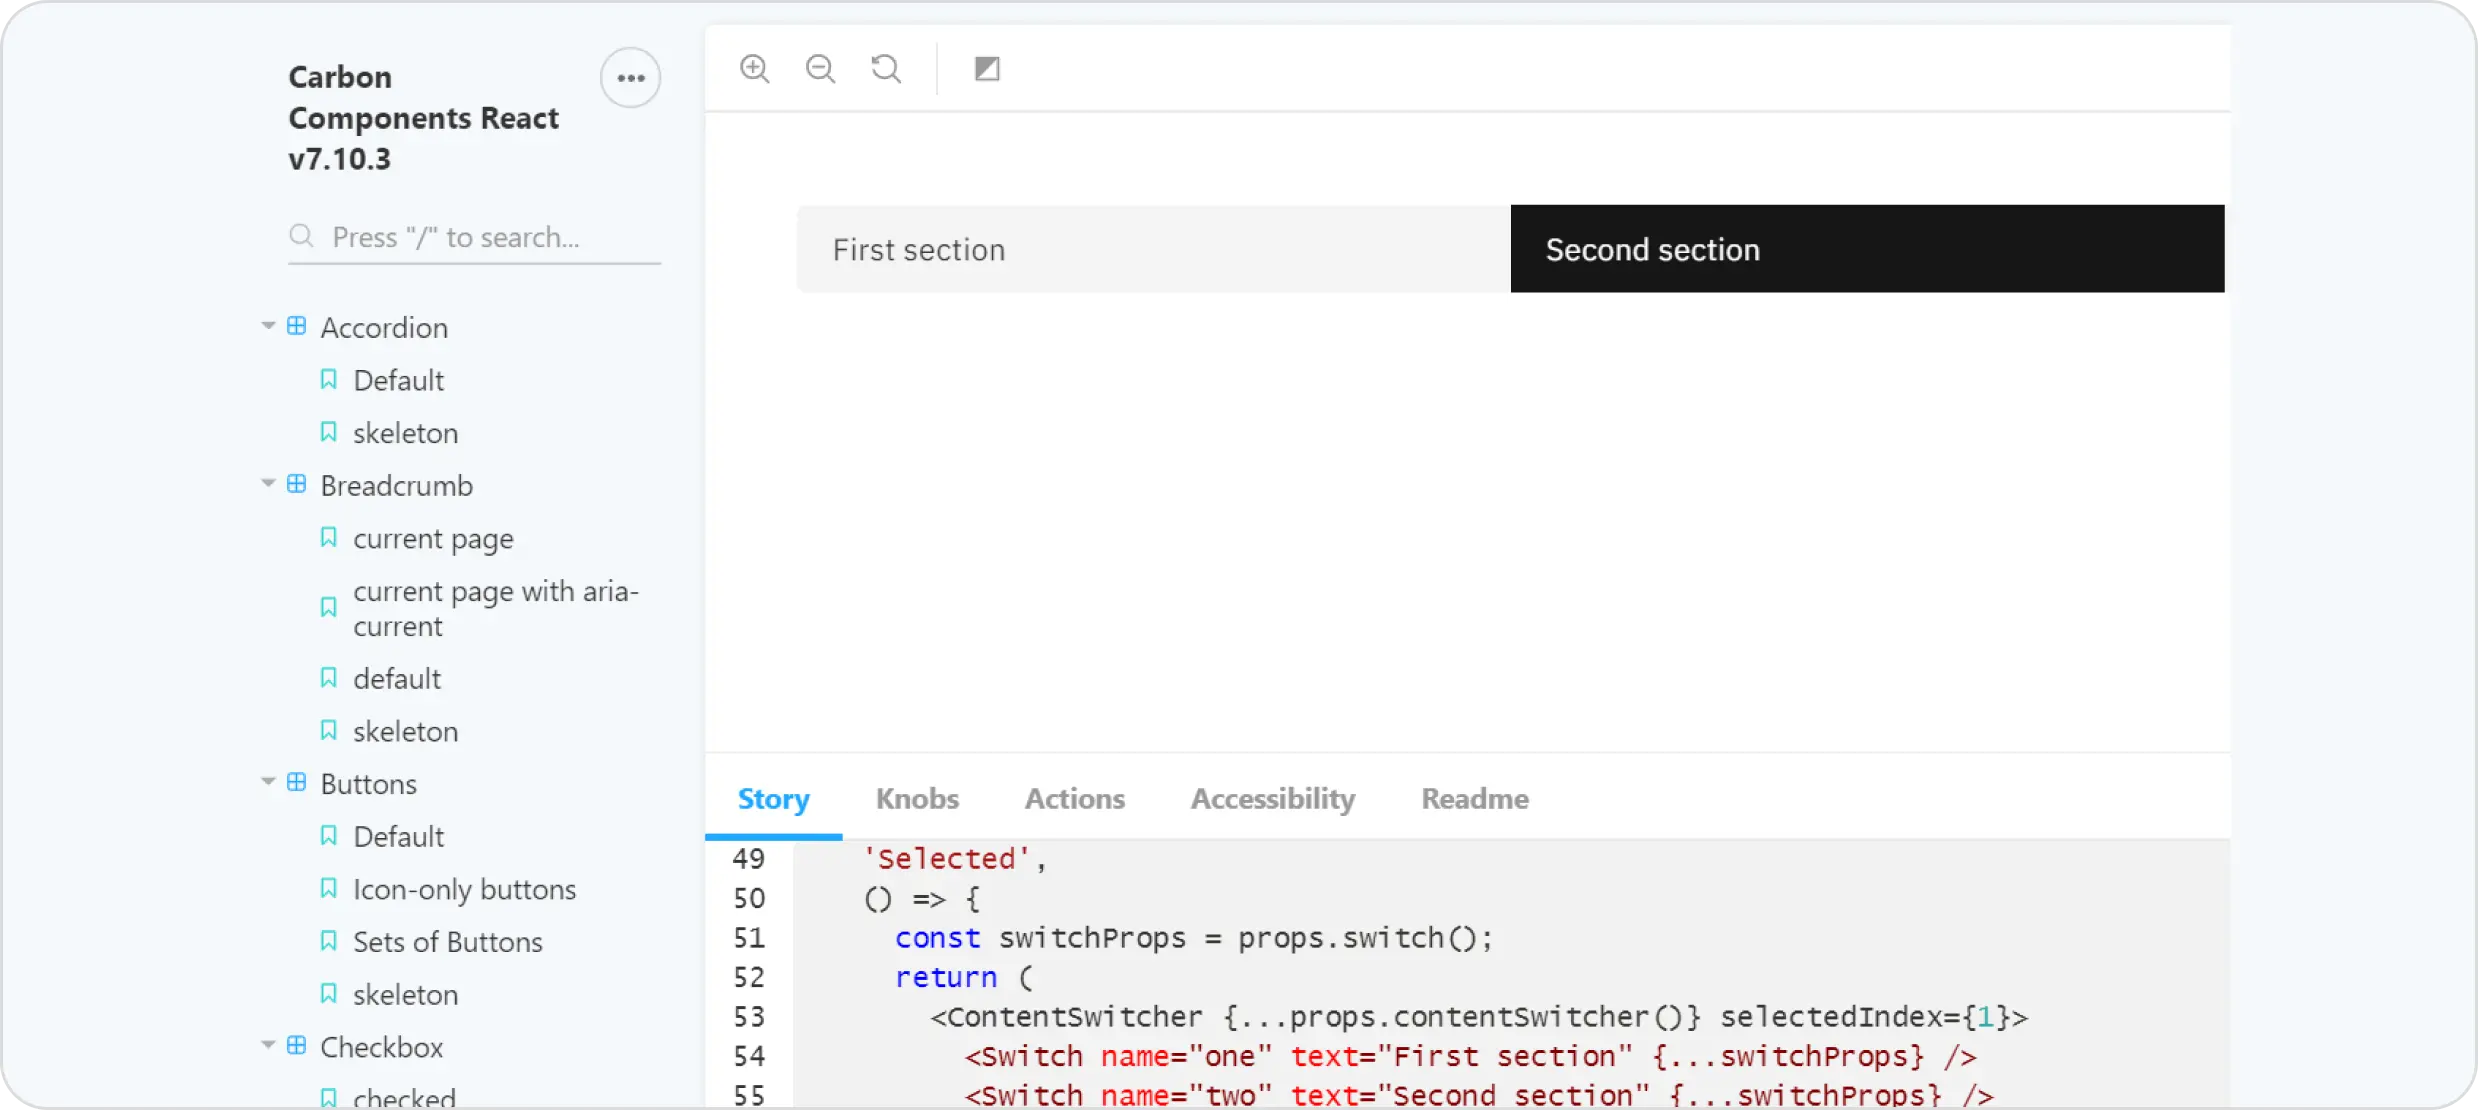
Visual debugging tools for ReactJS are a valuable aid when troubleshooting errors in applications. They offer a visual representation of the component hierarchy and allow developers to interact with components in real time.
Well-known visual debugging tools for ReactJS include React Sight, React Developer Tools and Storybook. They provide a visual representation of the component hierarchy and give insight into the connections between them.
Code quality tools play an important role in identifying potential problems in the code base, elevating the overall quality and effectively debugging a ReactJS app. They help detect issues such as unused variables, missing imports and duplicate code.
ESLint, Prettier, and SonarQube are recognized code-quality tools for ReactJS. They integrate seamlessly into the development workflow and provide real-time feedback. By using code quality instruments, developers can effectively identify and fix potential issues, thereby enhancing the overall quality of the application.
This technique offers comprehensive information on how to use ReactJS effectively and enables developers to gain a deep understanding of how the framework works.
By thoroughly reviewing the documentation, developers can familiarize themselves with the best practices for working with ReactJS. It also gives them a detailed insight into how to effectively use the various features of the framework.
The React Testing Library is a widely used testing framework designed specifically for React applications. It offers a set of tools that make testing components easier. This allows checking the rendered output of your components, simulating user interactions and examining the state and props of your components during the testing process.
Using the React Testing Library, developers can write comprehensive tests for their components. This ensures that they function as intended and helps catch any potential issues early on during the development phase. The framework's utilities provide a solid foundation for creating reliable and effective tests that lead to higher overall code quality and application stability.
To ensure the development and optimal performance of React applications, it's important to integrate debugging into the workflow in both the development and production phases.
In situations where you run into problems with React debugging or need quick fixes, relying on traditional JavaScript techniques, such as console statements, can be beneficial. They make it easier to establish and maintain a comprehensive development workflow that minimizes errors and thus reduces overall debugging effort.
Looking for a team of experts to perform effective debugging
of your ReactJS application? The skilled professionals at 111
Minutes are eager to assist you.
We're here to help you debug your app effectively with the
best techniques and tools. Rest assured that our team knows
how to fix all bugs and make sure your app runs smoothly.